Nearly twice the price
The typical HO-3 premium rose from $950 to $1,835 between 2000 and 2023, in 2025 dollars. That's real growth of 93%, not just inflation. In 22 states the average premium more than doubled after inflation.
A data story · 2000–2023
Insuring a home in America costs nearly twice what it did in 2000, even after inflation, and the fastest increases weren't only on the hurricane coasts.
This is the United States at its usual size.
In a moment, each state will be resized by one number: how much its homeowners pay, in total, to insure their homes each year.
In 2000, owners with a standard HO-3 policy paid about $43 billion a year in today's dollars.
HO-3 is the most common homeowners insurance policy. It covers the house itself against most kinds of damage, plus belongings and liability; flood and earthquake need separate policies. About four in five insured owner-occupied homes use it.
California, Florida, New York and Texas loom largest. They have the most homes, and they were already among the priciest places to insure.
Then came the hurricanes. Florida was hit by four in 2004, and by more in 2005.
By 2007, Florida's average premium had climbed from about $1,400 to $2,400.
The color of each state shows its change in insurance premium since 2000, after inflation. Darker means a bigger increase.
Part of Florida's jump around 2011 is bookkeeping. From that year on, the insurance commissioners' data includes Citizens, the state-run insurer of last resort that had become one of Florida's largest.
Insurer of last resort: a state-created insurer that covers homes private companies won't insure, or will only insure at very high prices. When private insurers pull back, these plans grow.
Through the 2010s, growth slowed but never stopped. By 2019 the national average was about $1,600, up from $950 in 2000.
By 2023, total premiums reached $103 billion, 2.4 times the 2000 level after inflation. Florida has overtaken California as the largest market.
Some states saw their premiums rise even more than Florida: look at the darkest ones, Minnesota, Rhode Island, Colorado and Nebraska. Part of the reason is that their premiums started lower.
The typical HO-3 premium rose from $950 to $1,835 between 2000 and 2023, in 2025 dollars. That's real growth of 93%, not just inflation. In 22 states the average premium more than doubled after inflation.
Louisiana, Texas and Florida are the most expensive places to insure a home. But the fastest growth came elsewhere. Minnesota started among the cheapest states at about $785 (in today's dollars) and finished at $2,101, a 2.7-fold increase.
What do Minnesota, Colorado, Nebraska and South Dakota have in common? Hail. A single storm can damage the roofs of an entire city at once. Minnesota's 2022 and 2023 storms caused at least $2.6 billion and $1.5 billion in damage, and the state's Commerce Department names hail and wind as its costliest threats.
Comparing NOAA storm reports with premium growth shows a real but moderate link. States with more damaging hail tended to see bigger increases (rank correlation +0.42). But hail doesn't explain everything: Rhode Island and Florida rose just as fast with very little hail.
And hail didn't simply become more frequent. Colorado's reports roughly tripled, but Minnesota's rose only modestly while its premiums grew the most of any state. Across states, the change in hail reports has essentially no relationship with premium growth. Industry sources point to the rising cost of each claim, especially roofs and building materials, as much of the rest of the story.
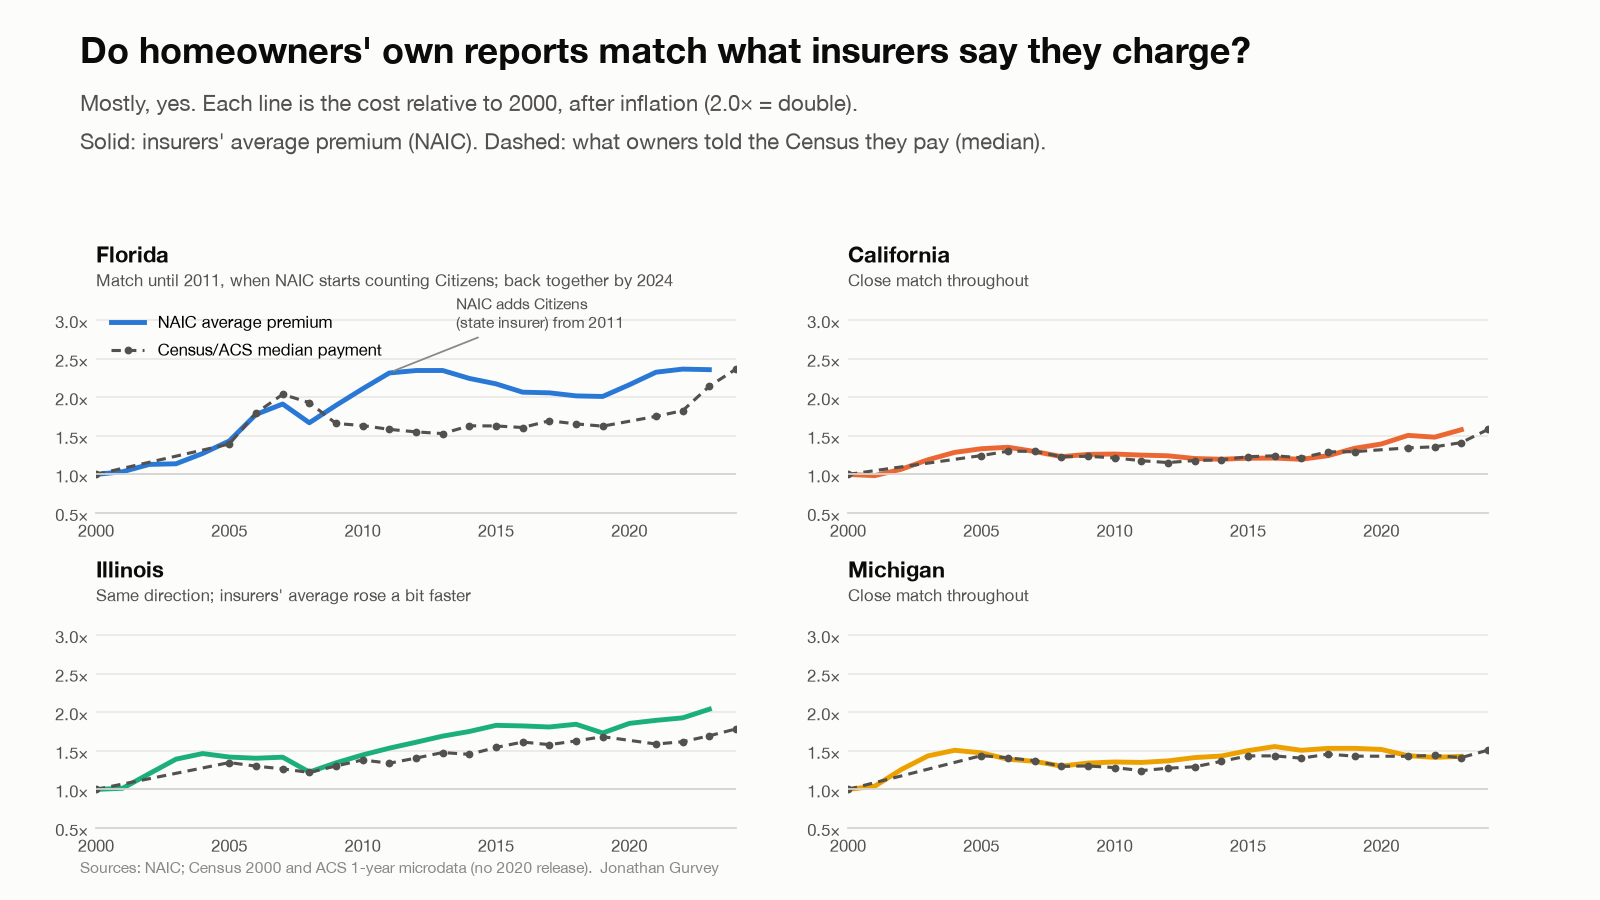
State averages hide big differences inside each state. For Florida, California, Illinois and Michigan, Census surveys ask homeowners what they pay for insurance. That allows a county-level view, from 2000 to 2024.
Drag the slider or press play. Hover a state for its numbers.
Mostly. Insurers' average premiums and homeowners' own reports track closely in California and Michigan. In Florida they split in 2011, when the NAIC data starts counting Citizens.
The cartogram uses the Dougenik, Chrisman and Niemeyer (1985) rubber-sheet algorithm on shared state borders, so neighboring states stay attached. Every year uses one scale of area per dollar, so the whole map grows as spending grows. Analysis in Python (pandas, shapely); site built with D3 and Scrollama.
Data: state series (JSON) · county series (JSON) · county ranking (Excel)